Edit 21/12/17: I found a bug in the implementation of 3 colors. Now it works properly.
Sometimes you want to present several curves on a single graph and want to do it with a gradually changing color to represent some kind of transition. Look at the following example:
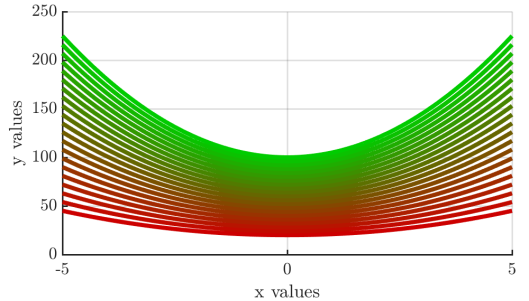
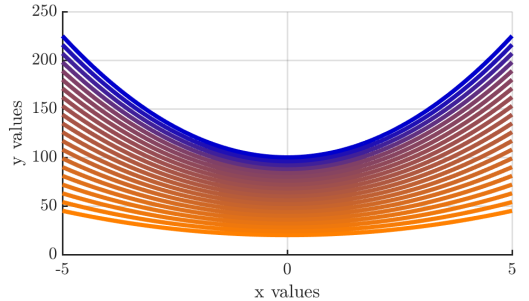
It was a gradual transition from red to green. An easy way to do this is to create a “color map” that contains the color gradient, which can be accessed from a running loop to select the correct color in each step. However, some gradients can be tricky. At the following example, the gradient is not symmetric. The transition is from orange to blue, but the average color is located 80% on the way from orange to blue (i.e. asymmetric gradient).
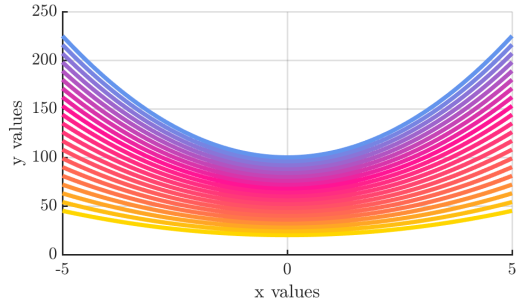
Finally, the following example is a gradient of 3 colors: from yellow to pink (mean color is defined at 25%), then pink (at 60%) and finally from pink to baby-blue (mean color at 80%).
Here is the code for doing this:
% figure skeletion
fig1 = figure;
axes1 = axes('Parent', fig1,'Units', 'pixels', 'Position', [60 45 425 230]);
grid(axes1,'on');
hold(axes1,'on');

% values for plotting
vals = 1:0.2:5;
x = linspace(-5, 5, length(vals));

% first example
colormap = colormapCreator({[0.8 0 0], [0 0.8 0]}, 0.5 ,length(vals));

% second example
colormap = colormapCreator({[1 0.5 0], [0 0 0.8]}, 0.8 ,length(vals));

% third example
colormap = colormapCreator({[1 0.84 0], [1 0.08 0.58], [0.39 0.58 0.93]}, [0.25 0.6 0.8] ,length(vals));

for i = 1:length(vals)
    current_color = colormap(i,:);
    current_y = 20*vals(i) + vals(i)*x.^2;
    plot(x, current_y, 'LineWidth', 4, 'Color', current_color);
end

xlabel('x values');
ylabel('y values');
The code of the “colormapCreator” function is below (you can download colormapCreator.m just change the extension from .m.doc to .m). The function gets 2 or 3 colors and 1 or 3 values (respectively) indicating the location of the transition between the colors (just use 0.5 for 2 colors or [0.25, 0.5, 0.75] for 3 colors to get symmetric gradients). The third input is the size of the gradient. This can be easily generalized for more colors, but I though that 4 and more colors is less common and preferred code readability.
function map = colormapCreator(colors, steps, n)

% gets a set of colors and creates a gradient map
% 'colors' is a cell of colors in format [r g b] from 0 to 1
% 'steps' has 1 value of color has 2 (and indicates the location of the
% mean color), or 3 values if color has 3 (and indicates the location of
% the mean of color 1 and 2, location of color 2 and location of mean of
% colors 2 and 3.
% 'n' is the size of the map
% for example, colormapCreator({[0 0 0], [1 0 0]}, 0.5, 10)
% will create a symmetric transition between black and red of size 10
% for example, colormapCreator({[0 0 0], [1 0 0]}, 0.2, 10)
% will create a transition between black and red of size 10, where
% the "center"  between red and black ([0.5 0 0]) will come after 20% of
% the members

    % make sure 'colors' is a cell
    if ~iscell(colors)
        error('The colors input must be a cell')
    end

    % make sure that 'colors' and 'steps' have corresponding lengths
    if length(colors) == 2
        if length(steps) ~= 1
            error('For 2 colors you must specify 1 step (transition between color 1 and 2)');
        end

    elseif length(colors) == 3
        if length(steps) ~= 3
            error('For 3 colors you must specify 3 steps (transition between color 1 and 2, position of color 2 and transition between color 2 and 3)');
        end
    end
    map = zeros(n,3);

    if length(colors) == 2
        col1 = colors{1};
        col2 = colors{2};
        center_color = 0.5*(col1 + col2);
        center_location = round(steps*n);
        map(1:center_location,:) = vector_linspace(col1, center_color, center_location);
        map(center_location:end,:) = vector_linspace(center_color, col2, n-center_location+1);

    elseif length(colors) == 3
        if steps(1) > steps(2)
            error('steps values must be in increasing order');
        end

        col1 = colors{1};
        col2 = colors{2};
        col3 = colors{3};

        % creating part 1
        n1 = round(steps(2)*n);
        step1 = steps(1)/steps(2);
        part1 = colormapCreator({col1, col2}, step1, n1);

        % creating part 2
        n2 = n - n1;
        step2 = (steps(3)-steps(2))/(1-steps(2));
        part2 = colormapCreator({col2, col3}, step2, n2+1);

        map = [part1; part2(2:end,:)];
    else
        error('The colors cell must have 2-3 members');
    end
end

function lin_vec = vector_linspace(vec1, vec2, n)
% just like linspace, bur for vectors
% no input verification is done
    size_of_vector = length(vec1);
    vec1 = reshape(vec1, 1, size_of_vector);
    vec2 = reshape(vec2, 1, size_of_vector);
    lin_vec = zeros(n, size_of_vector);
    for i = 1:size_of_vector
        lin = linspace(vec1(i),vec2(i),n);
        lin_vec(:,i) = lin';
    end
end


You must be logged in to post a comment.